In this article I share an illustration comparing the Payload vs Maximum Reach for 57 cobots. In my last post I shared some links to websites that list almost each and every cobot that the market currently has offer. Some of the websites provide comparison charts permitting the direct comparison of the listed cobots with respect to their primary specifications: payload capacity, maximum reach and repeatability. While those are nice, to me, a picture says more than thousand columns in a table.
Visualizing Cobot Characteristics
Hence, I thought it would be useful – not just for my own curiosity, but also for some people out there – to have some graphical visualization for the cobot specs. I was looking for such a thing on the web. Some OEMs provide such plots for their line-ups, but I was unable to find any comparative graphic. So I decided to make one.
Payload vs Maximum Reach
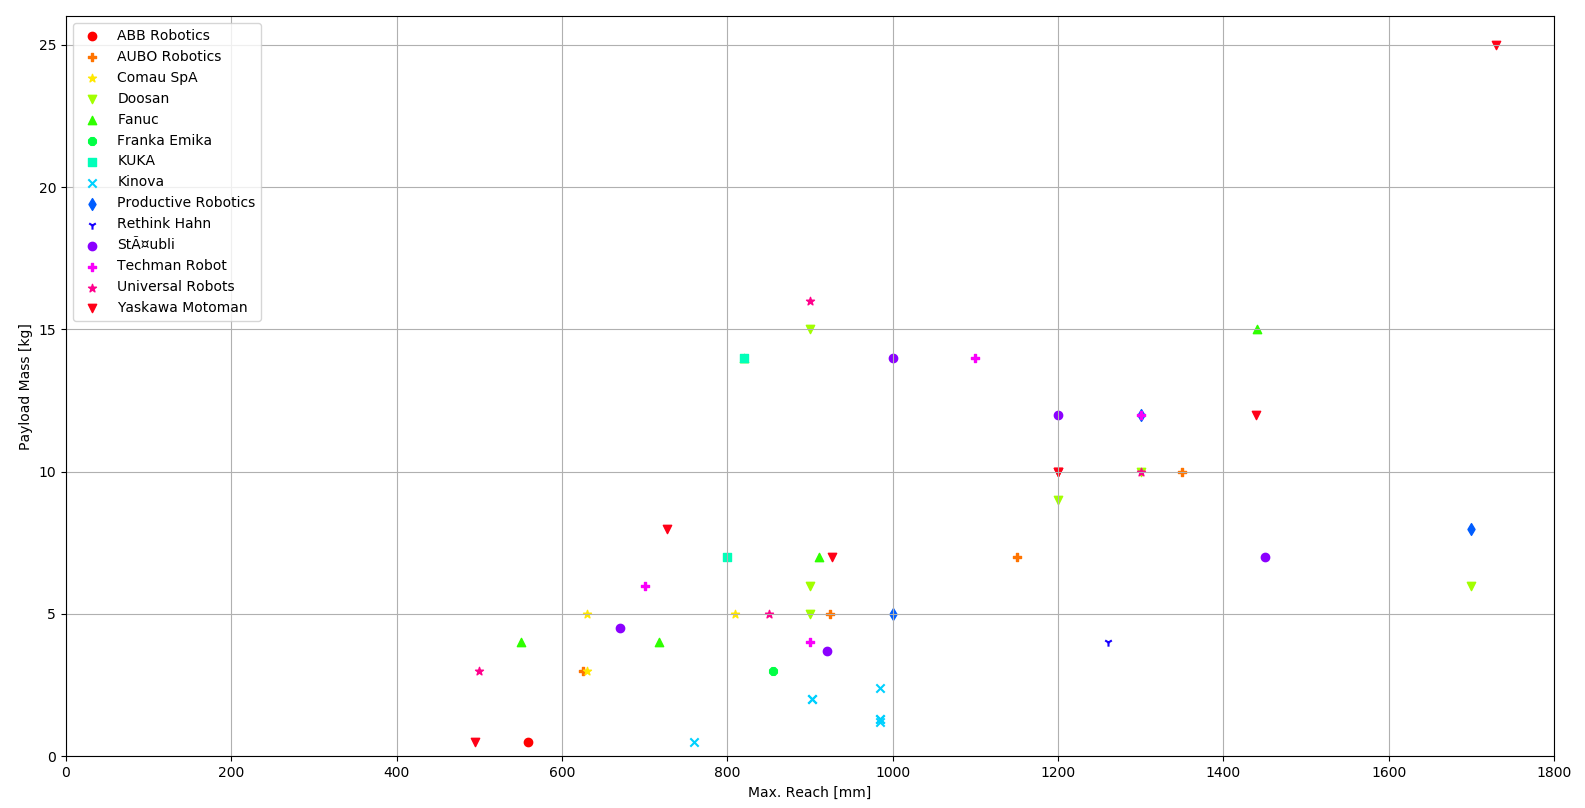
As a first visualization I chose to plot the Payload vs Maximum reach for various cobots out there. Have a look at the plot below.
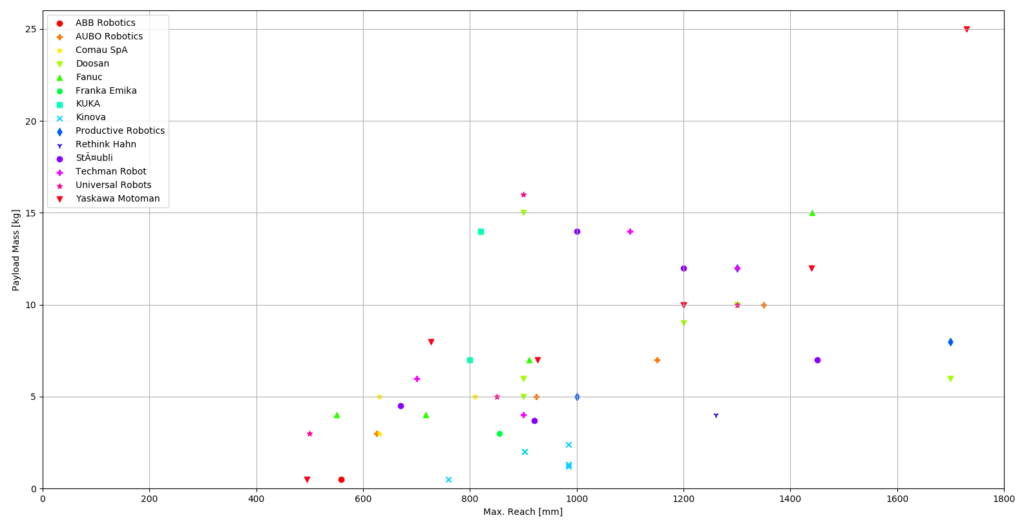
The figure displays a total of 57 cobots from 14 OEMs. Of course, the plot reflects an evolution of the work of engineers, product developers and sales people. They have identified the requirements of various profitable cobot applications and designed their product line-up accordingly.
Some Interesting Observations
Said this, the plot has some notable areas:
- There is an empty area for the payload mass 0-4 kg and max. reach > 1000 mm. This would be long-reach and low payload robots. Of course robots with sufficient reach and higher payload capacity can serve this segment. However, this probably results in an inefficient solution with the purchase of a robot that is way too powerful and potentially heavier than necessary. The latter might imply slower operation and longer cycle times. Potentially there are different solutions for such scenarios rather than using a cobot?
- There is another notable blank spot in the area from 700 mm and 1200 mm reach with a payload capacity of 9 to 14 kg. I am curious to understand the reason for this gap. Is there no profitable application requiring such a robot? Or are there better solutions in that range already in place?
- Cobots with a payload capacity of more than 15 kg are rare. In fact, there is a growing demand for cobots with higher payloads, especially for machine tending and palletizing applications. So I would expect see this region become more populated in the near future.
- There are basically no high payload (>5 kg) short reach robots (<700 or 800 mm). There seems to be a linear barrier towards low reach with a slope of approximately 3.75 kg / 100 mm reach. If you need to move a certain payload or apply a certain force within a comparably small workspace, you will accommodate a bigger robot in your line. Short and strong is not an option to buy. There does not seem to be a profitable application that asks for a robot with these characteristics. Would you have a use for such a robot?
What’s next?
The data displayed in the figure above is not exhaustive. I mean, the plot does not cover all cobots that you may find on the market. But I think it draws already a good picture of what you can buy. If you find a mistake or have some suggestions to update the plot, let me know.
Note, the payload and maximum reach are not the only characteristics that matter. The maximum velocity and also the payload inertia can play an equally important role. I am going to make a few more plots like this. Maybe there is something particular you would like to see?
1 thought on “Payload vs Maximum Reach for 57 Cobots”